")

The weather tiles can be retrieved like normal "tiled web maps" oder "slippy maps".
The schema of the URL is the following:
https://weather.openportguide.de/tiles/actual/variable/timestep/zoom/X/Y.png
In the moment the following variables are available:
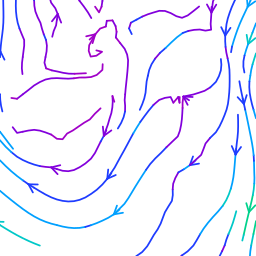
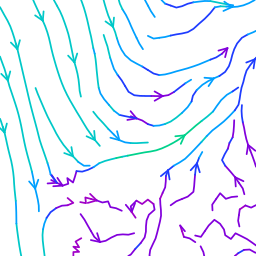
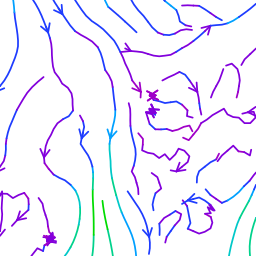
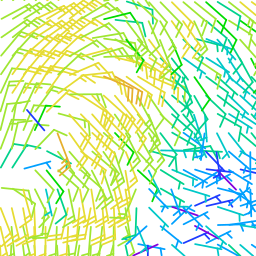
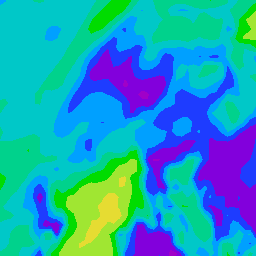
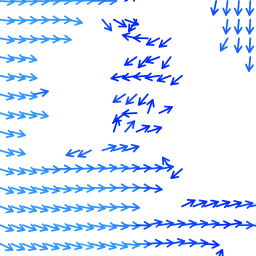
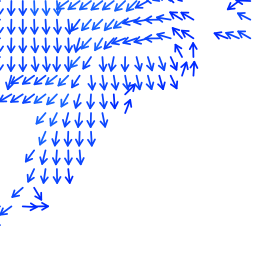
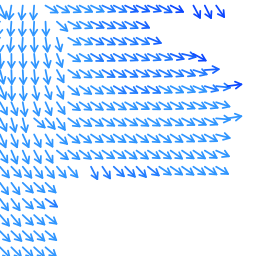
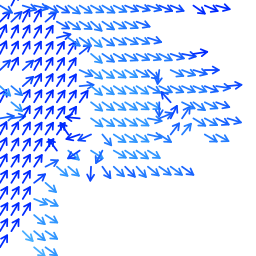
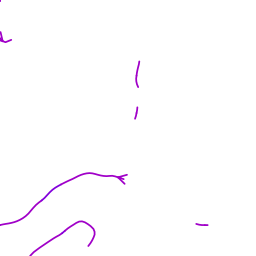
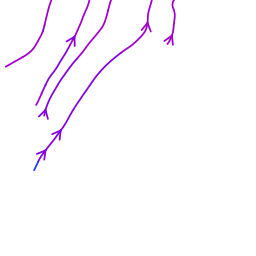
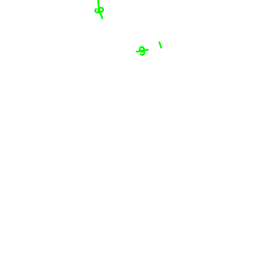
wind_stream:
Visualization of the average wind intensity in 10m height in Beaufort (Bft).
The direction of the arrow is in downwind direction. The color shows the wind intensity in Bft according to the following legend:
| Colour Sample | RGB Colour Code | Value |
|---|---|---|
| 160, 0, 200 | 0-1 BFT | |
| 130, 0, 220 | 1-2 BFT | |
| 30, 60, 255 | 2-3 BFT | |
| 0, 160, 255 | 3-4 BFT | |
| 0, 200, 200 | 4-5 BFT | |
| 0, 210, 140 | 5-6 BFT | |
| 0, 220, 0 | 6-7 BFT | |
| 160, 230, 50 | 7-8 BFT | |
| 230, 220, 50 | 8-9 BFT | |
| 230, 175, 45 | 9-10 BFT | |
| 240, 130, 40 | 10-11 BFT | |
| 250, 60, 60 | 11-12 BFT | |
| 240, 0, 130 | >12 BFT |
Example:
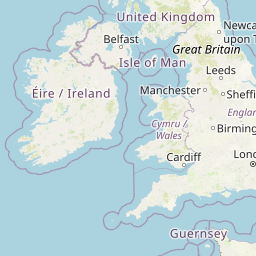
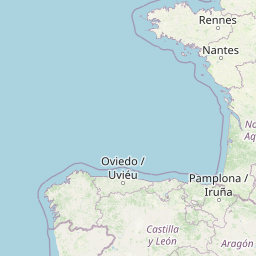
Picture top left, background: https://a.tile.openstreetmap.org/5/15/10.png
Picture top left, foreground: https://weather.openportguide.de/tiles/actual/wind_stream/0h/5/15/10.png
  |
  |
  |
  |
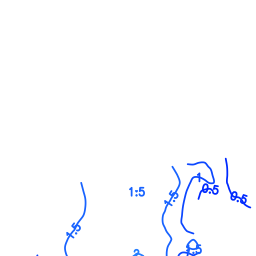
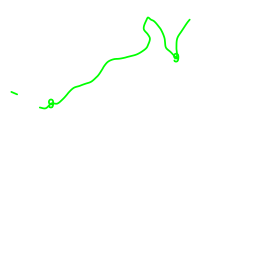
There is often a question araising about the alining of the stream lines of the wind_stream tiles:
At the border of the tiles the wind direction and speed is matching, but not the line.
That´s because each tile is calculated separatly (the software doesn´t know where the lines are ending at the neighbour tile).
There is nothing wrong, all values are correct for each position.
The only solution would be to generate the whole layer as one picture and then cut it into the small tiles. This would take to much cpu and memory resources (The server generates about 2000000 tiles every 6 hours).
At the other tiles the principle of tile generation is the same, but if you draw a line e.g. at a certain pressure, the lines are matching from tile to tile, as long as all calculations are correct.
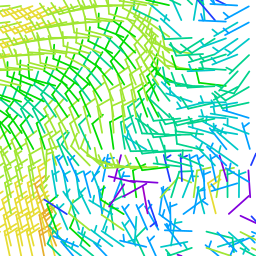
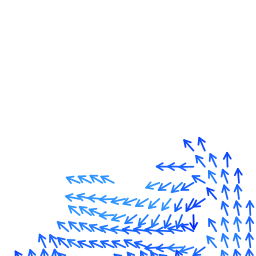
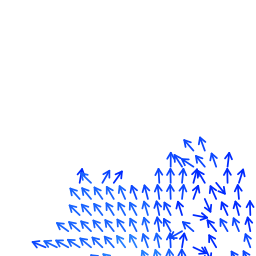
wind_barb:
Visualization of the average wind intensity in 10m height in knot (kn).
The direction of the barb is in upwind direction. The color shows the wind intensity in kn according to the following legend:
| Colour Sample | RGB Colour Code | Value |
|---|---|---|
| 160, 0, 200 | 0-1 kn | |
| 130, 0, 220 | 1-2 kn | |
| 30, 60, 255 | 2-3 kn | |
| 0, 160, 255 | 3-5 kn | |
| 0, 200, 200 | 5-7 kn | |
| 0, 210, 140 | 7-9 kn | |
| 0, 220, 0 | 9-10 kn | |
| 160, 230, 50 | 10-15 kn | |
| 230, 220, 50 | 15-20 kn | |
| 230, 175, 45 | 20-25 kn | |
| 240, 130, 40 | 25-35 kn | |
| 250, 60, 60 | 35-50 kn | |
| 240, 0, 130 | >50 kn |
Example:
Picture top left, background: https://a.tile.openstreetmap.org/5/15/10.png
Picture top left, foreground: https://weather.openportguide.de/tiles/actual/wind_barb/0h/5/15/10.png
 |
 |
 |
 |
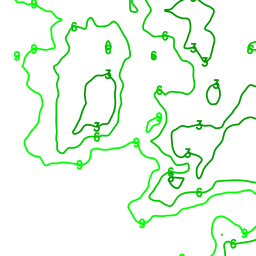
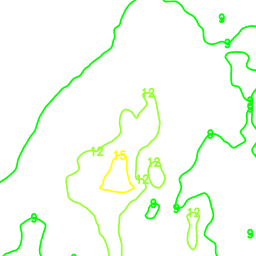
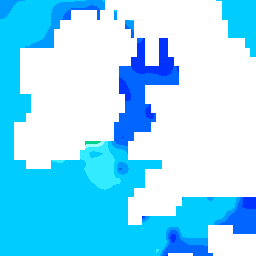
gust:
Visualization of the wind gust intensity near ground Beaufort (Bft).
The color indicates the wind gust intensity in Bft according to the following legend:
| Colour Sample | RGB Colour Code | Value |
|---|---|---|
| 160, 0, 200 | 0-1 BFT | |
| 130, 0, 220 | 1-2 BFT | |
| 30, 60, 255 | 2-3 BFT | |
| 0, 160, 255 | 3-4 BFT | |
| 0, 200, 200 | 4-5 BFT | |
| 0, 210, 140 | 5-6 BFT | |
| 0, 220, 0 | 6-7 BFT | |
| 160, 230, 50 | 7-8 BFT | |
| 230, 220, 50 | 8-9 BFT | |
| 230, 175, 45 | 9-10 BFT | |
| 240, 130, 40 | 10-11 BFT | |
| 250, 60, 60 | 11-12 BFT | |
| 240, 0, 130 | 12-13 BFT | |
| 241, 48, 151 | 13-14 BFT | |
| 243, 97, 175 | 14-15 BFT | |
| 243, 146, 198 | 15-16 BFT | |
| 243, 195, 221 | 16-17 BFT | |
| 243, 243, 243 | >17 BFT |
Example:
Picture top left, background: https://a.tile.openstreetmap.org/5/15/10.png
Picture top left, foreground: https://weather.openportguide.de/tiles/actual/gust/0h/5/15/10.png, opacity 30%
 |
 |
 |
 |
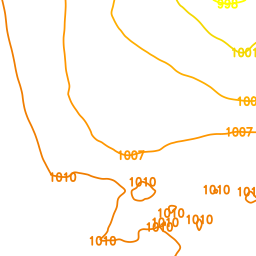
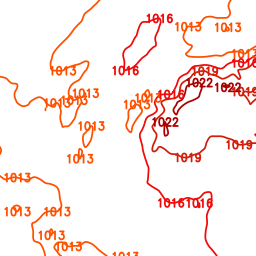
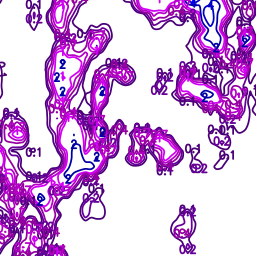
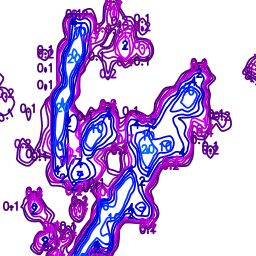
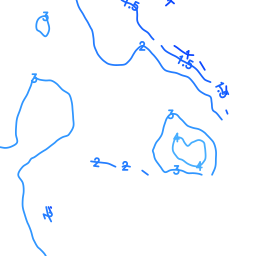
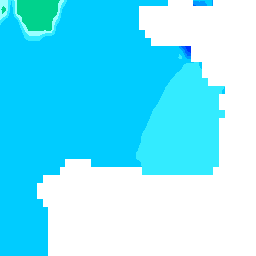
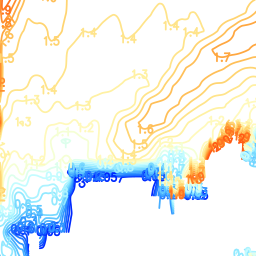
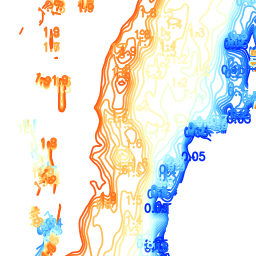
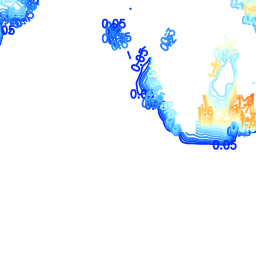
surface_pressure:
Visualization of the atmospheric pressure by isobars in hecto pascal (hPa).
The isobars are lines with the same atmospheric pressure.
The color indicates the atmospheric pressure in hPa according to the following legend:
| Colour Sample | RGB Colour Code | Value | Colour Sample | RGB Colour Code | Value | Colour Sample | RGB Colour Code | Value |
|---|---|---|---|---|---|---|---|---|
| 210, 0, 244 | 851 hPa | 210, 0, 244 | 941 hPa | 210, 0, 244 | 1031 hPa | |||
| 180, 0, 200 | 854 hPa | 180, 0, 200 | 944 hPa | 180, 0, 200 | 1034 hPa | |||
| 150, 0, 160 | 857 hPa | 150, 0, 160 | 947 hPa | 150, 0, 160 | 1037 hPa | |||
| 102, 0, 153 | 860 hPa | 102, 0, 153 | 950 hPa | 102, 0, 153 | 1040 hPa | |||
| 75, 0, 120 | 863 hPa | 75, 0, 120 | 953 hPa | 75, 0, 120 | 1043 hPa | |||
| 0, 0, 166 | 866 hPa | 0, 0, 166 | 956 hPa | 0, 0, 166 | 1046 hPa | |||
| 0, 0, 200 | 869 hPa | 0, 0, 200 | 959 hPa | 0, 0, 200 | 1049 hPa | |||
| 0, 0, 255 | 872 hPa | 0, 0, 255 | 962 hPa | 0, 0, 255 | 1052 hPa | |||
| 0, 51, 255 | 875 hPa | 0, 51, 255 | 965 hPa | 0, 51, 255 | 1055 hPa | |||
| 0, 102, 255 | 878 hPa | 0, 102, 255 | 968 hPa | 0, 102, 255 | 1058 hPa | |||
| 0, 153, 255 | 881 hPa | 0, 153, 255 | 971 hPa | 0, 153, 255 | 1061 hPa | |||
| 0, 204, 255 | 884 hPa | 0, 204, 255 | 974 hPa | 0, 204, 255 | 1064 hPa | |||
| 51, 235, 255 | 887 hPa | 51, 235, 255 | 977 hPa | 51, 235, 255 | 1067 hPa | |||
| 153, 255, 255 | 890 hPa | 153, 255, 255 | 980 hPa | 153, 255, 255 | 1070 hPa | |||
| 0, 210, 140 | 893 hPa | 0, 210, 140 | 983 hPa | 0, 210, 140 | 1073 hPa | |||
| 0, 153, 0 | 896 hPa | 0, 153, 0 | 986 hPa | 0, 153, 0 | 1076 hPa | |||
| 0, 204, 0 | 899 hPa | 0, 204, 0 | 989 hPa | 0, 204, 0 | 1079 hPa | |||
| 0, 255, 0 | 902 hPa | 0, 255, 0 | 992 hPa | 0, 255, 0 | 1082 hPa | |||
| 153, 255, 51 | 905 hPa | 153, 255, 51 | 995 hPa | 153, 255, 51 | 1085 hPa | |||
| 255, 255, 0 | 908 hPa | 255, 255, 0 | 998 hPa | 255, 255, 0 | 1088 hPa | |||
| 244, 215, 0 | 911 hPa | 244, 215, 0 | 1001 hPa | 244, 215, 0 | 1091 hPa | |||
| 254, 174, 0 | 914 hPa | 254, 174, 0 | 1004 hPa | 254, 174, 0 | 1094 hPa | |||
| 254, 150, 0 | 917 hPa | 254, 150, 0 | 1007 hPa | 254, 150, 0 | 1097 hPa | |||
| 240, 125, 0 | 920 hPa | 240, 125, 0 | 1010 hPa | 240, 125, 0 | 1100 hPa | |||
| 255, 80, 0 | 923 hPa | 255, 80, 0 | 1013 hPa | |||||
| 240, 10, 10 | 926 hPa | 240, 10, 10 | 1016 hPa | |||||
| 210, 30, 10 | 929 hPa | 210, 30, 10 | 1019 hPa | |||||
| 170, 0, 0 | 932 hPa | 170, 0, 0 | 1022 hPa | |||||
| 140, 0, 0 | 935 hPa | 140, 0, 0 | 1025 hPa | |||||
| 110, 0, 0 | 938 hPa | 110, 0, 0 | 1028 hPa |
Example:
Picture top left, background: https://a.tile.openstreetmap.org/5/15/10.png
Picture top left, foreground: https://weather.openportguide.de/tiles/actual/surface_pressure/0h/5/15/10.png
 |
 |
 |
 |
air_temperature:
Visualization of the air temperature in 2m height above the ground in degree Celsius (°C).
| Colour Sample | RGB Colour Code | Value |
|---|---|---|
| 210, 0, 244 | -42 °C | |
| 180, 0, 200 | -39 °C | |
| 150, 0, 160 | -36 °C | |
| 102, 0, 153 | -33 °C | |
| 75, 0, 120 | -30 °C | |
| 0, 0, 166 | -27 °C | |
| 0, 0, 200 | -24 °C | |
| 0, 0, 255 | -21 °C | |
| 0, 51, 255 | -18 °C | |
| 0, 102, 255 | -15 °C | |
| 0, 153, 255 | -12 °C | |
| 0, 204, 255 | -9 °C | |
| 51, 235, 255 | -6 °C | |
| 153, 255, 255 | -3 °C | |
| 0, 210, 140 | 0 °C | |
| 0, 153, 0 | 3 °C | |
| 0, 204, 0 | 6 °C | |
| 0, 255, 0 | 9 °C | |
| 153, 255, 51 | 12 °C | |
| 255, 255, 0 | 15 °C | |
| 244, 215, 0 | 18 °C | |
| 254, 174, 0 | 21 °C | |
| 254, 150, 0 | 24 °C | |
| 240, 125, 0 | 27 °C | |
| 255, 80, 0 | 30 °C | |
| 240, 10, 10 | 33 °C | |
| 210, 30, 10 | 36 °C | |
| 170, 0, 0 | 39 °C | |
| 140, 0, 0 | 42 °C | |
| 110, 0, 0 | 45 °C |
Example:
Picture top left, background: https://a.tile.openstreetmap.org/5/15/10.png
Picture top left, foreground: https://weather.openportguide.de/tiles/actual/air_temperature/0h/5/15/10.png
 |
 |
 |
 |
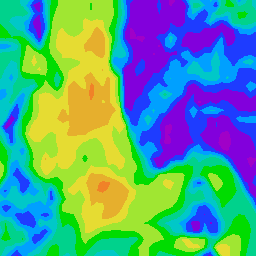
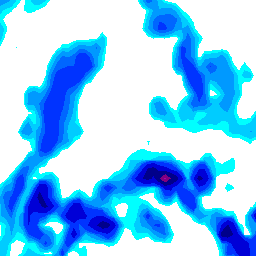
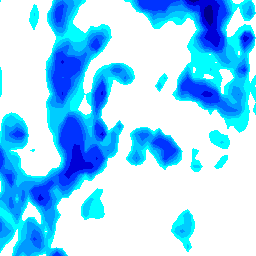
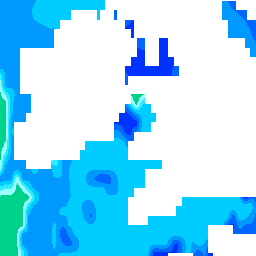
precipitation:
Visualization of the amount of precipitation in mm/m2h.
The displayed amount of precipitation had changed since the 1st of August 2016:
now:
For the timesteps 0h and 6h the average amount of precipitation in liter per hour for the next 6 hours will be displayed.
For the timesteps 12h, 24h, 36h, 48h, 60h and 72h the average amount of precipitation in liter per hour for the next 12 hours will be displayed.
Now it´s easier to compare the precipitation values of the different timesteps as they are all displayed in liter per hour.
before:
For the timesteps 5, 7 und 9 the amount of precipitation is accumulated for the next 6h,
for the timesteps 11, 15, 19, 23 und 27 the amount of precipitation is accumulated for the next 12h.
| Colour Sample | RGB Colour Code | Value |
|---|---|---|
| 75, 0, 120 | 0.1 mm | |
| 102, 0, 153 | 0.2 mm | |
| 150, 0, 160 | 0.4 mm | |
| 180, 0, 200 | 0.7 mm | |
| 210, 0, 244 | 1 mm | |
| 0, 0, 166 | 2 mm | |
| 0, 0, 200 | 4 mm | |
| 0, 0, 255 | 7 mm | |
| 0, 51, 255 | 10 mm | |
| 0, 102, 255 | 20 mm | |
| 0, 153, 255 | 40 mm | |
| 0, 204, 255 | 70 mm |
Example:
Picture top left, background: https://a.tile.openstreetmap.org/5/15/10.png
Picture top left, foreground: https://weather.openportguide.de/tiles/actual/precipitation/0h/5/15/10.png
 |
 |
 |
 |
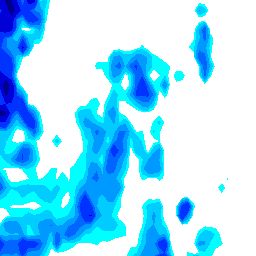
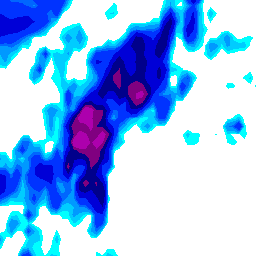
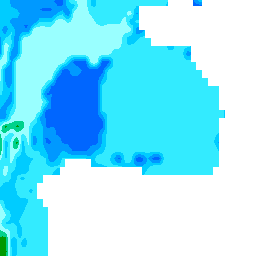
precipitation_shaded:
Visualization of the amount of precipitation in mm/m2h.
The displayed amount of precipitation had changed since the 1st of August 2016:
now:
For the timesteps 0h and 6h the average amount of precipitation in liter per hour for the next 6 hours will be displayed.
For the timesteps 12h, 24h, 36h, 48h, 60h and 72h the average amount of precipitation in liter per hour for the next 12 hours will be displayed.
Now it´s easier to compare the precipitation values of the different timesteps as they are all displayed in liter per hour.
before:
For the timesteps 5, 7 und 9 the amount of precipitation is accumulated for the next 6h,
for the timesteps 11, 15, 19, 23 und 27 the amount of precipitation is accumulated for the next 12h.
Hint: It looks great if the layer "precipitation_shaded" is displayed with an opacity of 30% and the layer "precipitation" on top with an opacity of 100%.
| Colour Sample | RGB Colour Code | Value |
|---|---|---|
| 0, 255, 255 | >=0.1 mm | |
| 0, 204, 255 | >=0.2 mm | |
| 0, 153, 255 | >=0.4 mm | |
| 0, 102, 255 | >=0.7 mm | |
| 0, 51, 255 | >=1 mm | |
| 0, 0, 215 | >=2 mm | |
| 0, 0, 139 | >=4 mm | |
| 128, 0, 128 | >=7 mm | |
| 173, 0, 173 | >=10 mm | |
| 219, 0, 219 | >=20 mm | |
| 252, 88, 252 | >=40 mm | |
| 252, 151, 252 | >=70 mm |
Example:
Picture top left, background: https://a.tile.openstreetmap.org/5/15/10.png
Picture top left, foreground: https://weather.openportguide.de/tiles/actual/precipitation_shaded/0h/5/15/10.png
 |
 |
 |
 |
significant_wave_height:
Visualization of the average wave height in m.
| Colour Sample | RGB Colour Code | Value |
|---|---|---|
| 75, 0, 120 | 0.5 m | |
| 102, 0, 153 | 1 m | |
| 150, 0, 160 | 1.5 m | |
| 180, 0, 200 | 2 m | |
| 210, 0, 244 | 3 m | |
| 0, 0, 166 | 4 m | |
| 0, 0, 200 | 5 m | |
| 0, 0, 255 | 6 m | |
| 0, 51, 255 | 7 m | |
| 0, 102, 255 | 8 m | |
| 0, 153, 255 | 9 m | |
| 0, 204, 255 | 10 m | |
| 51, 235, 255 | 11 m | |
| 153, 255, 255 | 12 m | |
| 0, 210, 140 | 13 m | |
| 0, 153, 0 | 14 m | |
| 0, 204, 0 | 15 m | |
| 0, 255, 0 | 16 m | |
| 153, 255, 51 | 17 m | |
| 255, 255, 0 | 18 m | |
| 244, 215, 0 | 19 m | |
| 254, 174, 0 | 20 m |
Example:
Picture top left, background: https://a.tile.openstreetmap.org/5/15/10.png
Picture top left, foreground: https://weather.openportguide.de/tiles/actual/significant_wave_height/0h/5/15/10.png
 |
 |
 |
 |
primary_wave_height_direction:
Visualization of the average significant wave height in m and direction.
| Colour Sample | RGB Colour Code | Value |
|---|---|---|
| 0, 42, 255 | 0-0.5 m | |
| 12, 71, 255 | 0.5-1 m | |
| 24, 99, 255 | 1-1.5 m | |
| 36, 125, 255 | 1.5-2 m | |
| 48, 150, 255 | 2-3 m | |
| 71, 174, 255 | 3-4 m | |
| 96, 199, 255 | 4-5 m | |
| 121, 217, 255 | 5-6 m | |
| 146, 233, 255 | 6-7 m | |
| 171, 243, 255 | 7-8 m | |
| 196,252,255 | 8-9 m | |
| 221, 255, 237 | 9-10 m | |
| 245, 255, 213 | 10-11 m | |
| 255, 249, 188 | 11-12 m | |
| 255, 241, 163 | 12-13 m | |
| 255, 228, 138 | 13-14 m | |
| 255, 212, 113 | 14-15 m | |
| 255, 191, 88 | 15-16 m | |
| 255, 167, 64 | 16-17 m | |
| 255, 142, 44 | 17-18 m | |
| 255, 117, 32 | 18-19 m | |
| 255, 91, 20 | 19-20 m | |
| 255, 62, 8 | >20m |
Example:
Picture top left, background: https://a.tile.openstreetmap.org/5/15/10.png
Picture top left, foreground: https://weather.openportguide.de/tiles/actual/primary_wave_height_direction/0h/5/15/10.png
 |
 |
 |
 |
primary_wave_period:
Visualization of the average wave period in s.
| Colour Sample | RGB Colour Code | Value |
|---|---|---|
| 0, 0, 255 | 0-2 s | |
| 0, 51, 255 | 2-4 s | |
| 0, 102, 255 | 4-6 s | |
| 0, 153, 255 | 6-8 s | |
| 0, 204, 255 | 8-10 s | |
| 51, 235, 255 | 10-12 s | |
| 153, 255, 255 | 12-14 s | |
| 0, 210, 140 | 14-16 s | |
| 0, 153, 0 | 16-18 s | |
| 0, 204, 0 | 18-20 s | |
| 0, 255, 0 | 20-22 s | |
| 153, 255, 51 | 22-24 s | |
| 255, 255, 0 | 24-26 s | |
| 244, 215, 0 | 26-28 s | |
| 254, 174, 0 | 28-30 s | |
| 255, 110, 0 | >30 s |
Example:
Picture top left, background: https://a.tile.openstreetmap.org/5/15/10.png
Picture top left, foreground: https://weather.openportguide.de/tiles/actual/primary_wave_period/0h/5/15/10.png
 |
 |
 |
 |
swell_height_direction:
Visualization of the average swell height in m and direction.
| Colour Sample | RGB Colour Code | Value |
|---|---|---|
| 0, 42, 255 | 0-0.5 m | |
| 12, 71, 255 | 0.5-1 m | |
| 24, 99, 255 | 1-1.5 m | |
| 36, 125, 255 | 1.5-2 m | |
| 48, 150, 255 | 2-3 m | |
| 71, 174, 255 | 3-4 m | |
| 96, 199, 255 | 4-5 m | |
| 121, 217, 255 | 5-6 m | |
| 146, 233, 255 | 6-7 m | |
| 171, 243, 255 | 7-8 m | |
| 196,252,255 | 8-9 m | |
| 221, 255, 237 | 9-10 m | |
| 245, 255, 213 | 10-11 m | |
| 255, 249, 188 | 11-12 m | |
| 255, 241, 163 | 12-13 m | |
| 255, 228, 138 | 13-14 m | |
| 255, 212, 113 | 14-15 m | |
| 255, 191, 88 | 15-16 m | |
| 255, 167, 64 | 16-17 m | |
| 255, 142, 44 | 17-18 m | |
| 255, 117, 32 | 18-19 m | |
| 255, 91, 20 | 19-20 m | |
| 255, 62, 8 | >20m |
Example:
Picture top left, background: https://a.tile.openstreetmap.org/5/15/10.png
Picture top left, foreground: https://weather.openportguide.de/tiles/actual/swell_height_direction/0h/5/15/10.png
 |
 |
 |
 |
swell_period:
Visualization of the average swell period in s.
| Colour Sample | RGB Colour Code | Value |
|---|---|---|
| 0, 0, 255 | 0-2 s | |
| 0, 51, 255 | 2-4 s | |
| 0, 102, 255 | 4-6 s | |
| 0, 153, 255 | 6-8 s | |
| 0, 204, 255 | 8-10 s | |
| 51, 235, 255 | 10-12 s | |
| 153, 255, 255 | 12-14 s | |
| 0, 210, 140 | 14-16 s | |
| 0, 153, 0 | 16-18 s | |
| 0, 204, 0 | 18-20 s | |
| 0, 255, 0 | 20-22 s | |
| 153, 255, 51 | 22-24 s | |
| 255, 255, 0 | 24-26 s | |
| 244, 215, 0 | 26-28 s | |
| 254, 174, 0 | 28-30 s | |
| 255, 110, 0 | >30 s |
Example:
Picture top left, background: https://a.tile.openstreetmap.org/5/15/10.png
Picture top left, foreground: https://weather.openportguide.de/tiles/actual/swell_period/0h/5/15/10.png
 |
 |
 |
 |
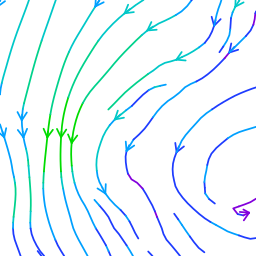
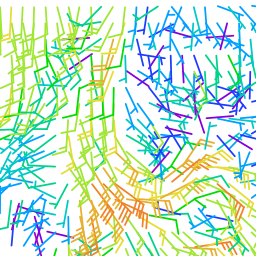
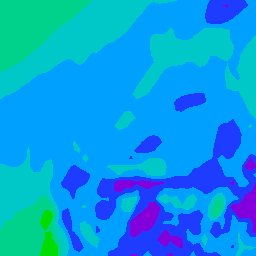
sea_surface_current:
Visualization of the average sea surface current in knot (kn).
The direction of the arrow is in the current direction. The color shows the speed of the current in kn according to the following legend:
| Colour Sample | RGB Colour Code | Value |
|---|---|---|
| 160, 0, 200 | 0-0,2 kn | |
| 130, 0, 220 | 0,2-0,5 kn | |
| 30, 60, 255 | 0,5-1 kn | |
| 0, 160, 255 | 1-1,5 kn | |
| 0, 200, 200 | 1,5-2 kn | |
| 0, 210, 140 | 2-2,5 kn | |
| 0, 220, 0 | 2,5-3 kn | |
| 160, 230, 50 | 3-4 kn | |
| 230, 220, 50 | 4-5 kn | |
| 230, 175, 45 | 5-6 kn | |
| 240, 130, 40 | 6-7 kn | |
| 250, 60, 60 | 7-8 kn | |
| 240, 0, 130 | >8 kn |
Example:
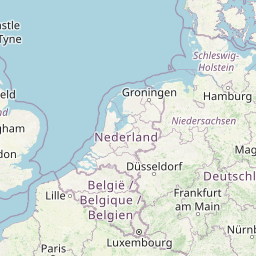
Picture top left, background: https://a.tile.openstreetmap.org/5/15/10.png
Picture top left, foreground: https://weather.openportguide.de/tiles/actual/sea_surface_current/0h/5/15/10.png
 |
 |
 |
 |
There is often a question araising about the alining of the stream lines of the sea_surface_current tiles:
At the border of the tiles the current direction and speed is matching, but not the line.
That´s because each tile is calculated separatly (the software doesn´t know where the lines are ending at the neighbour tile).
There is nothing wrong, all values are correct for each position.
The only solution would be to generate the whole layer as one picture and then cut it into the small tiles. This would take to much cpu and memory resources (The server generates about 2000000 tiles every 6 hours).
At the other tiles the principle of tile generation is the same, but if you draw a line e.g. at a certain pressure, the lines are matching from tile to tile, as long as all calculations are correct.
sea_surface_temperature:
Visualization of the sea surface temperature in degree Celsius (°C). The color of the lines indicates the temperature of the sea surface in °C according to the following legend:
| Colour Sample | RGB Colour Code | Value |
|---|---|---|
| 0, 153, 255 | -12 °C | |
| 0, 204, 255 | -9 °C | |
| 51, 235, 255 | -6 °C | |
| 153, 255, 255 | -3 °C | |
| 0, 210, 140 | 0 °C | |
| 0, 153, 0 | 3 °C | |
| 0, 204, 0 | 6 °C | |
| 0, 255, 0 | 9 °C | |
| 153, 255, 51 | 12 °C | |
| 255, 255, 0 | 15 °C | |
| 244, 215, 0 | 18 °C | |
| 254, 174, 0 | 21 °C | |
| 254, 150, 0 | 24 °C | |
| 240, 125, 0 | 27 °C | |
| 255, 80, 0 | 30 °C | |
| 240, 10, 10 | 33 °C | |
| 210, 30, 10 | 36 °C | |
| 170, 0, 0 | 39 °C | |
| 140, 0, 0 | 42 °C | |
| 110, 0, 0 | 45 °C |
Example:
Picture top left, background: https://a.tile.openstreetmap.org/5/15/10.png
Picture top left, foreground, Vordergrund: https://weather.openportguide.de/tiles/actual/sea_surface_temperature/0h/5/15/10.png
 |
 |
 |
 |
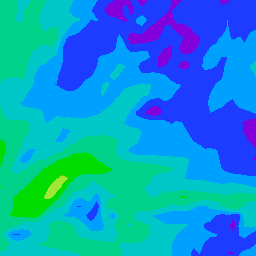
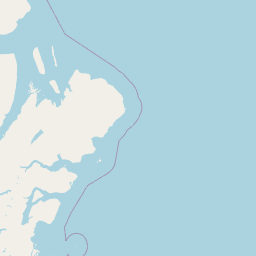
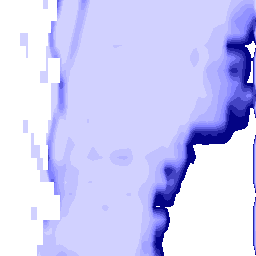
sea_ice_coverage:
Visualization of the ice covered sea area in %. The color of the shading indicates the coverage of the ice in % according to the following legend:
| Colour Sample | RGB Colour Code | Value |
|---|---|---|
| 4, 4, 132 | 1-10% | |
| 36,36,164 | 10-20% | |
| 68, 68, 195 | 20-30 % | |
| 100, 100, 227 | 30-40 % | |
| 130, 130, 255 | 40-50 % | |
| 146, 146, 255 | 50-60 % | |
| 162, 162, 255 | 60-70 % | |
| 178, 178, 255 | 70-80 % | |
| 193, 193, 255 | 80-90 % | |
| 209, 209, 255 | >90 % |
Example:
Picture top left, background: https://a.tile.openstreetmap.org/4/7/1.png
Picture top left, foreground: https://weather.openportguide.de/tiles/actual/sea_ice_coverage/0h/4/7/1.png
  |
  |
  |
  |
sea_ice_thickness:
Visualization of the thickness of the ice in m. The color of the lines indicates the thickness of the ice in m according to the following legend:
| Colour Sample | RGB Colour Code | Value |
|---|---|---|
| 0, 42, 255 | 0,01-0,05 m | |
| 12, 71, 255 | 0,05-0,1 m | |
| 24, 99, 255 | 0,1-0,15 m | |
| 36, 125, 255 | 0,15-0,2 m | |
| 48, 150, 255 | 0,2-0,3 m | |
| 71, 174, 255 | 0,3-0,4 m | |
| 96, 199, 255 | 0,4-0,5 m | |
| 121, 217, 255 | 0,5-0,6 m | |
| 146, 233, 255 | 0,6-0,7 m | |
| 171, 243, 255 | 0,7-0,8 m | |
| 196, 252, 255 | 0,8-0,9 m | |
| 221, 255, 237 | 0,9-1 m | |
| 245, 255, 213 | 1-1,1 m | |
| 255, 249, 188 | 1,1-1,2 m | |
| 255, 241, 163 | 1,2-1,3 m | |
| 255, 228, 138 | 1,3-1,4 m | |
| 255, 212, 113 | 1,4-1,5 m | |
| 255, 191, 88 | 1,5-1,6 m | |
| 255, 167, 64 | 1,6-1,7 m | |
| 255, 142, 44 | 1,7-1,8 m | |
| 255, 117, 32 | 1,8-1,9 m | |
| 255, 91, 20 | 1,9-2 m | |
| 255, 62, 8 | >2 m |
Example:
Picture top left, background: https://a.tile.openstreetmap.org/4/7/1.png
Picture top left, foreground: https://weather.openportguide.de/tiles/actual/sea_ice_thickness/0h/4/7/1.png
 |
 |
 |
 |