Status: transfer from DODS-data to partial https downloads ongoing on dev server (weather.openportguide.org) and prod server (weather.openportguide.de)
| done: | todo: |
|
data aquision running for: GFS-Model |
- |
|
Visualisation of new data: Individual weather maps working:
|
- |
|
Visualisation for weather tiles |
- |
| - | JSON data interface |
| Transfer of new software to production server (weather.openportguide.de) | - |
| - | Implementation for new weather parameters |
September 1st, 2021
- added: automated download of RTOFS-data by https as netcdf from NOAA
- added: remapping of difficult projection of the RTOFS data to simple rectangular projection and save in grib2 format
- added: visalisation for the following weather tiles: sea_surface_current, sea_surface_temperature, sea_ice_coverage, sea_ice_thickness
- added: visualisation of the following individual weather maps: sea_surface_current, sea_surface_temperature, sea_ice_coverage, sea_ice_thickness
July 3rd, 2021
- added: automated generation of special grib2 file with data collection for generation of meteograms
- added: generation of meteograms are working with more detailed data, quite fast (more then 1200 data points out of 3000000000 in less than 2 sec
 .)
.)
June 6th, 2021
- added: automated generation of netcdf file with data collection for generation of meteograms (found better solution)
June 3th, 2021
- changed: due to heavy issues with the NOAA DODS-servers I was forced to move the new (beta) software to the production server, because via the DODS "path" it was impossible to get reliable data anymore.
Advantages:
- The weather tiles as described in the status table above should work reliable from now.
- Same for the "individual weather maps".
Disadvantages:
- meteograms are not working anymore (will be fixed) - added: automated download of OSCAR Ocean data
May 12th, 2021
- added: weather tiles generation with GFS data running
- added: weather tiles generation with GFS-wave data running
May 1st, 2021
- added: individual weather maps with GFS data running
- added: individual weather maps with GFS-wave data running
- removed: the usage of the RTOFS data is temporary? not possible due to two issues:
- NOAA don´t get the DODS-Server with the RTOFS data running, see: https://polar.ncep.noaa.gov/global/data_access.shtml?
- The visualization software is not able to work with the "full file downloads" due to the complicated map projection:
The issue here is the combination of mercator projection and Arctic bi-polar projection.
April 26th, 2021
- added: automated generation of grib2 description and index files
April 21th, 2021
- Bugfixes at new data aquision:
- support files will be actualised before old data will be removed
- support files will not be empty if no new data are available
April 18th, 2021
- testing of new data cquision on new dev server und implementation on old dev server (to implement it later on the old production server untill the new system is completely ready.
Main changes:
- changed lot of common code cleanup
- added: path to curl in environment for old server
- changed: model time = UTC+5,5h ... instead of +5h
- corrected RTOFS file name calculation
- added: several improvements of the logging
- added: communication between parent and child processes by files on (ram)disk
- added: file size check of all downloaded files
- changed: timedelay for retries changed from 1 to 10 seconds
- changed: outdated data will be deleted at the end of each model download instead of the end of all downloads to save ramdisk space
April 8th, 2021
- The complete data acquision on a dev server had been changed from DODS downloads to HTTPS downloads.
(Speed) comparasion:
DODS-downloads HTTPS-downloads GFS-Parameters
(atmoshere data)19 33 of more than 600 available Resolution in data points (lat*lon) 361*720 721*1440 Timesteps 81 (3h, 10 days) 288 (1h, 5 days, 3h day 6-10) Datapoints 400 016 880 9 867 432 960 Dataformat netcdf grib2 Time to download 720 sec 170 sec speed factor per data point 1 104 times faster GFSwave-Parameters
(ocean wave data)9 19 Resolution (lat*lon) 336*720 721*1440 Timesteps 61 (3h, 7,5 days) 288 (1h, 5 days, 3h day 6-10) Datapoints 132 814 080 5 681 249 280 Dataformat netcdf grib2 Time to download 360 sec 130 sec speed factor per data point 1 118 times faster RTOFS-Parameters
(Ocean data exept wave data)5 10 Resolution (lat*lon) 2160*4320 3298*4500 Timesteps 65 (3h, 8 days) 112 (1h, 3 days, 3h, day 4-8) Datapoints 3 032 640 000 16 621 920 000 Dataformat netcdf netcdf Time to download 6240 sec 990 sec speed factor per data point 1 34 times faster - new: parallel downloads (about 5-6 times faster with 10 parallel downloads)
- new: partial https downloads are reducing the server load on NOAA side (about 5 times faster than requests through DODS server)
- new: unsage o grib2 format instead of netcdf (about 4 times faster due to transmission of compressed data)
- new. complete rewritten validation of correctness of the received data
March 1st, 2021
- Due to slow and unreliable downloads via the DODS-server, the decision for a change of the complete data acquision to https-downloads had been made.
Also the support for the https downloads seems to be much better then for the DODS server.
weather.openportguide.de puts weatherforecasts into graphs.
The following visualizations are availabe:
- Weather tiles in mercator projection ready for overlay over "tiled web maps" or "slippy maps" like google maps or openstreetmap.
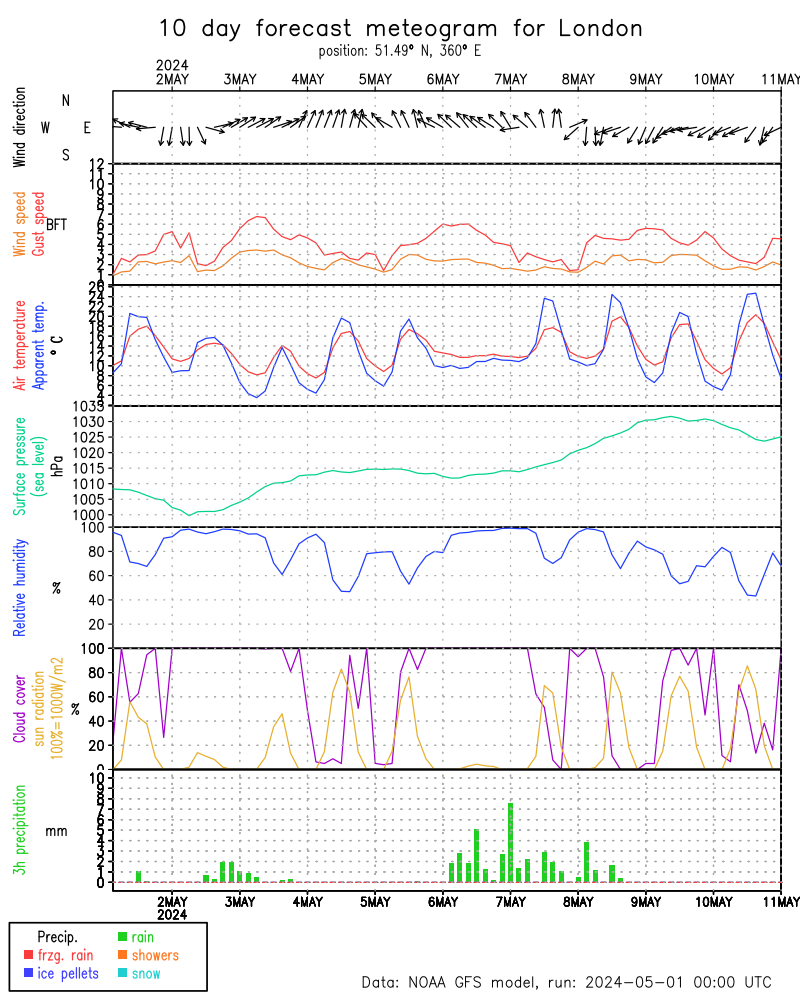
- Meteograms showing a 8 day forecast for any position on earth.
An example with temperatures tiles above OSM tiles:
  |
  |
  |
  |
An example for a meteogram of London:

Subcategories
Description
Beschreibung / Anleitung


